Patrick Rael, Department of History, Bowdoin College
If you find these maps useful, please contact me.

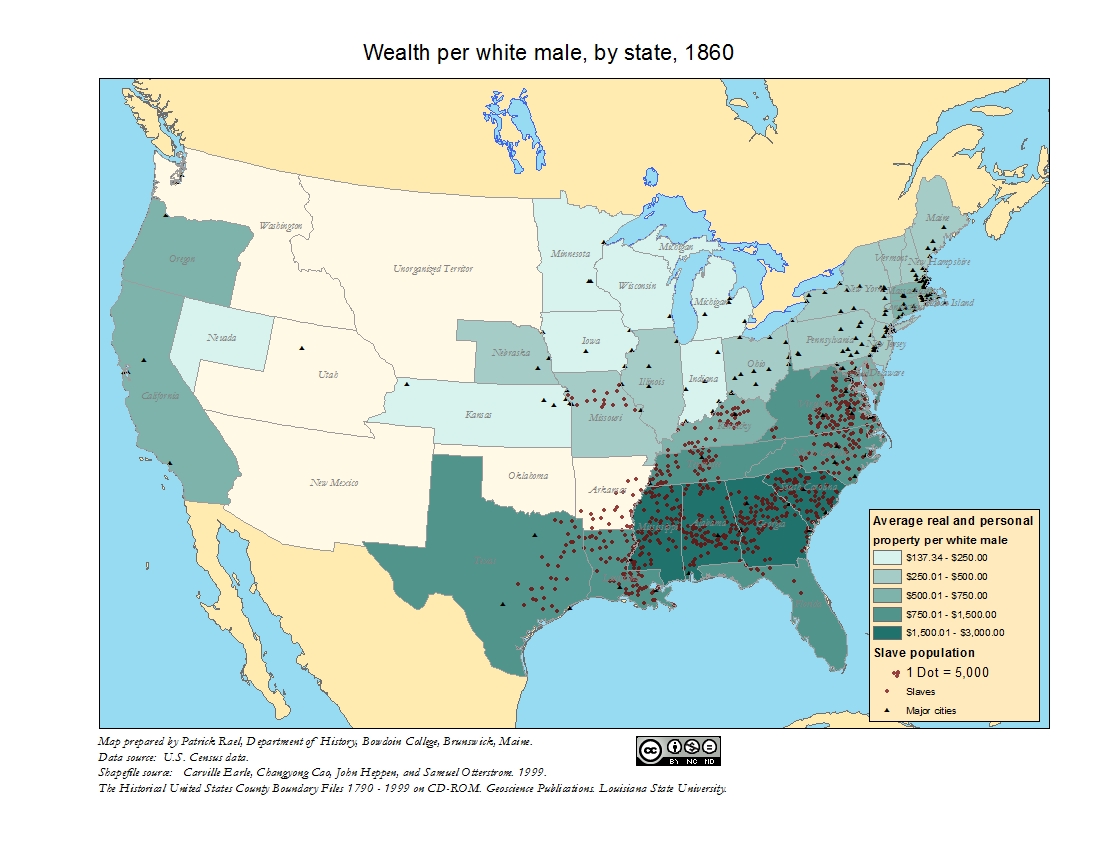
I wondered if we could use GIS to see what we could learn about the demand for enslaved laborers. I presumed that counties with "farms" (plantations) of high value and dense slave concentrations could serve as effective markers of labor demand. I also wondered if we could use the gender and age information provided by the census data to locate areas of high labor demand. I hypothesized that we might find higher concentrations of men, and lower concentrations of children, in areas of high labor demand. So let's work through some maps and see what we can see.
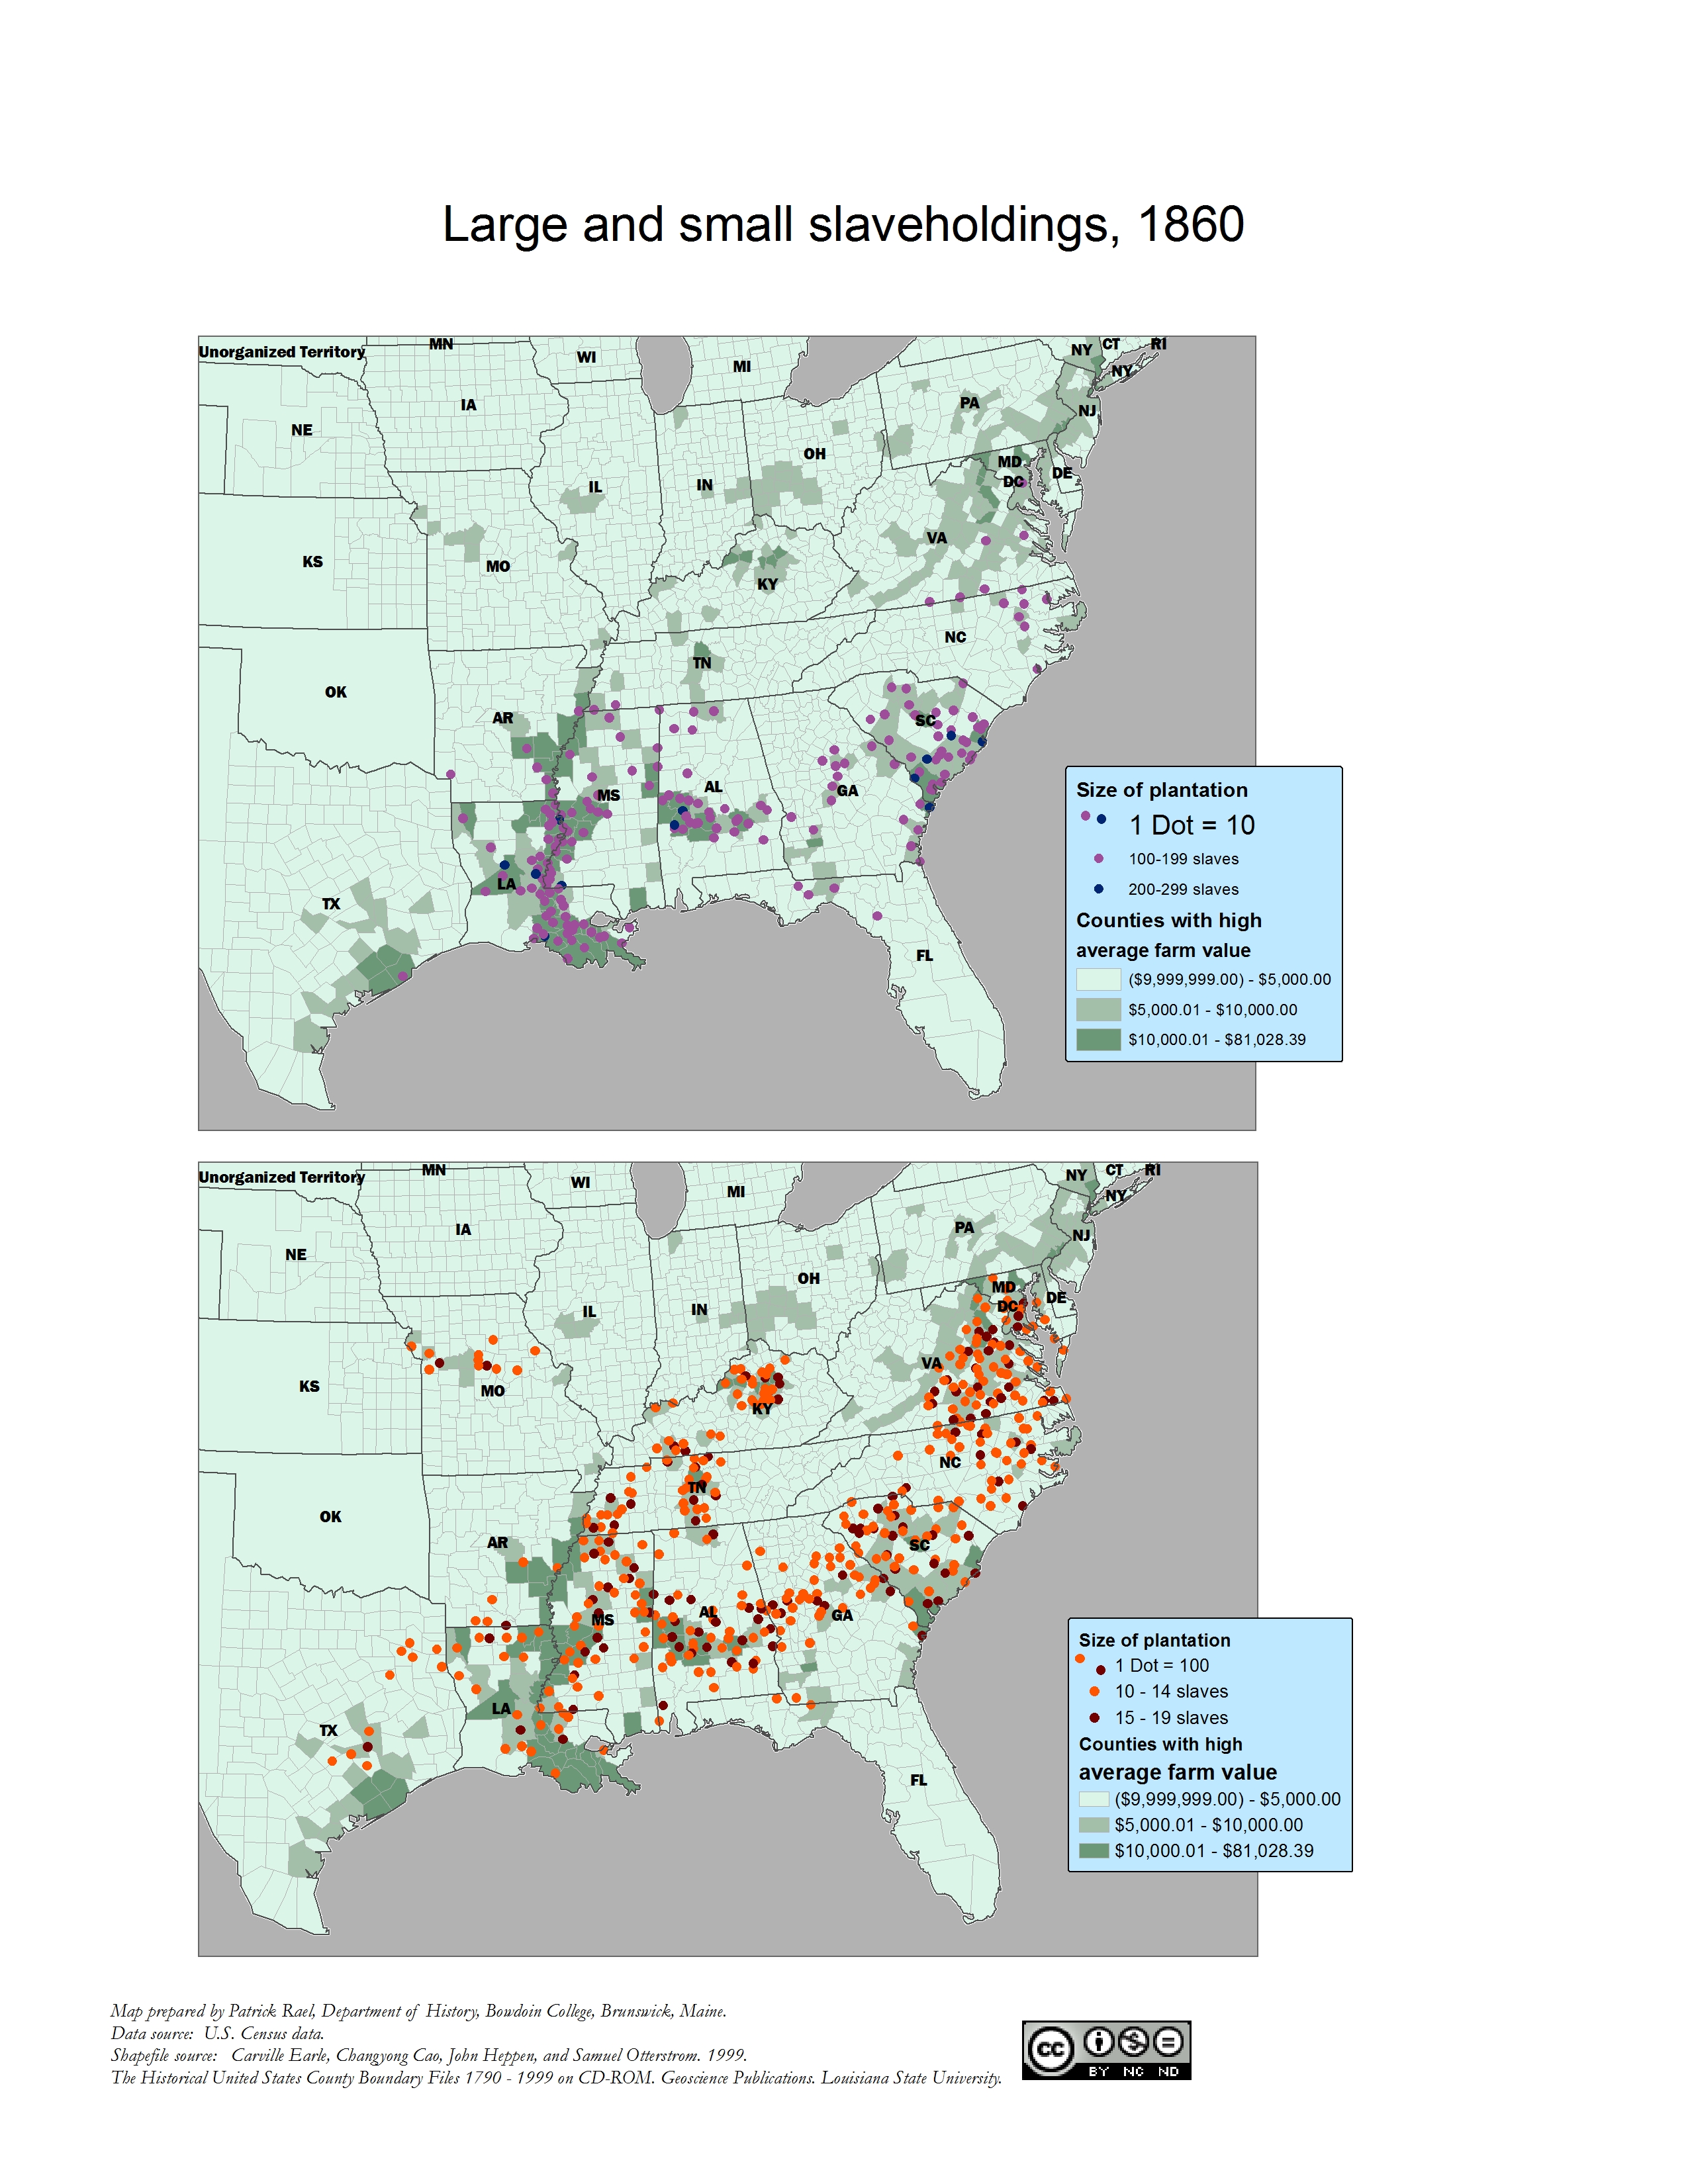
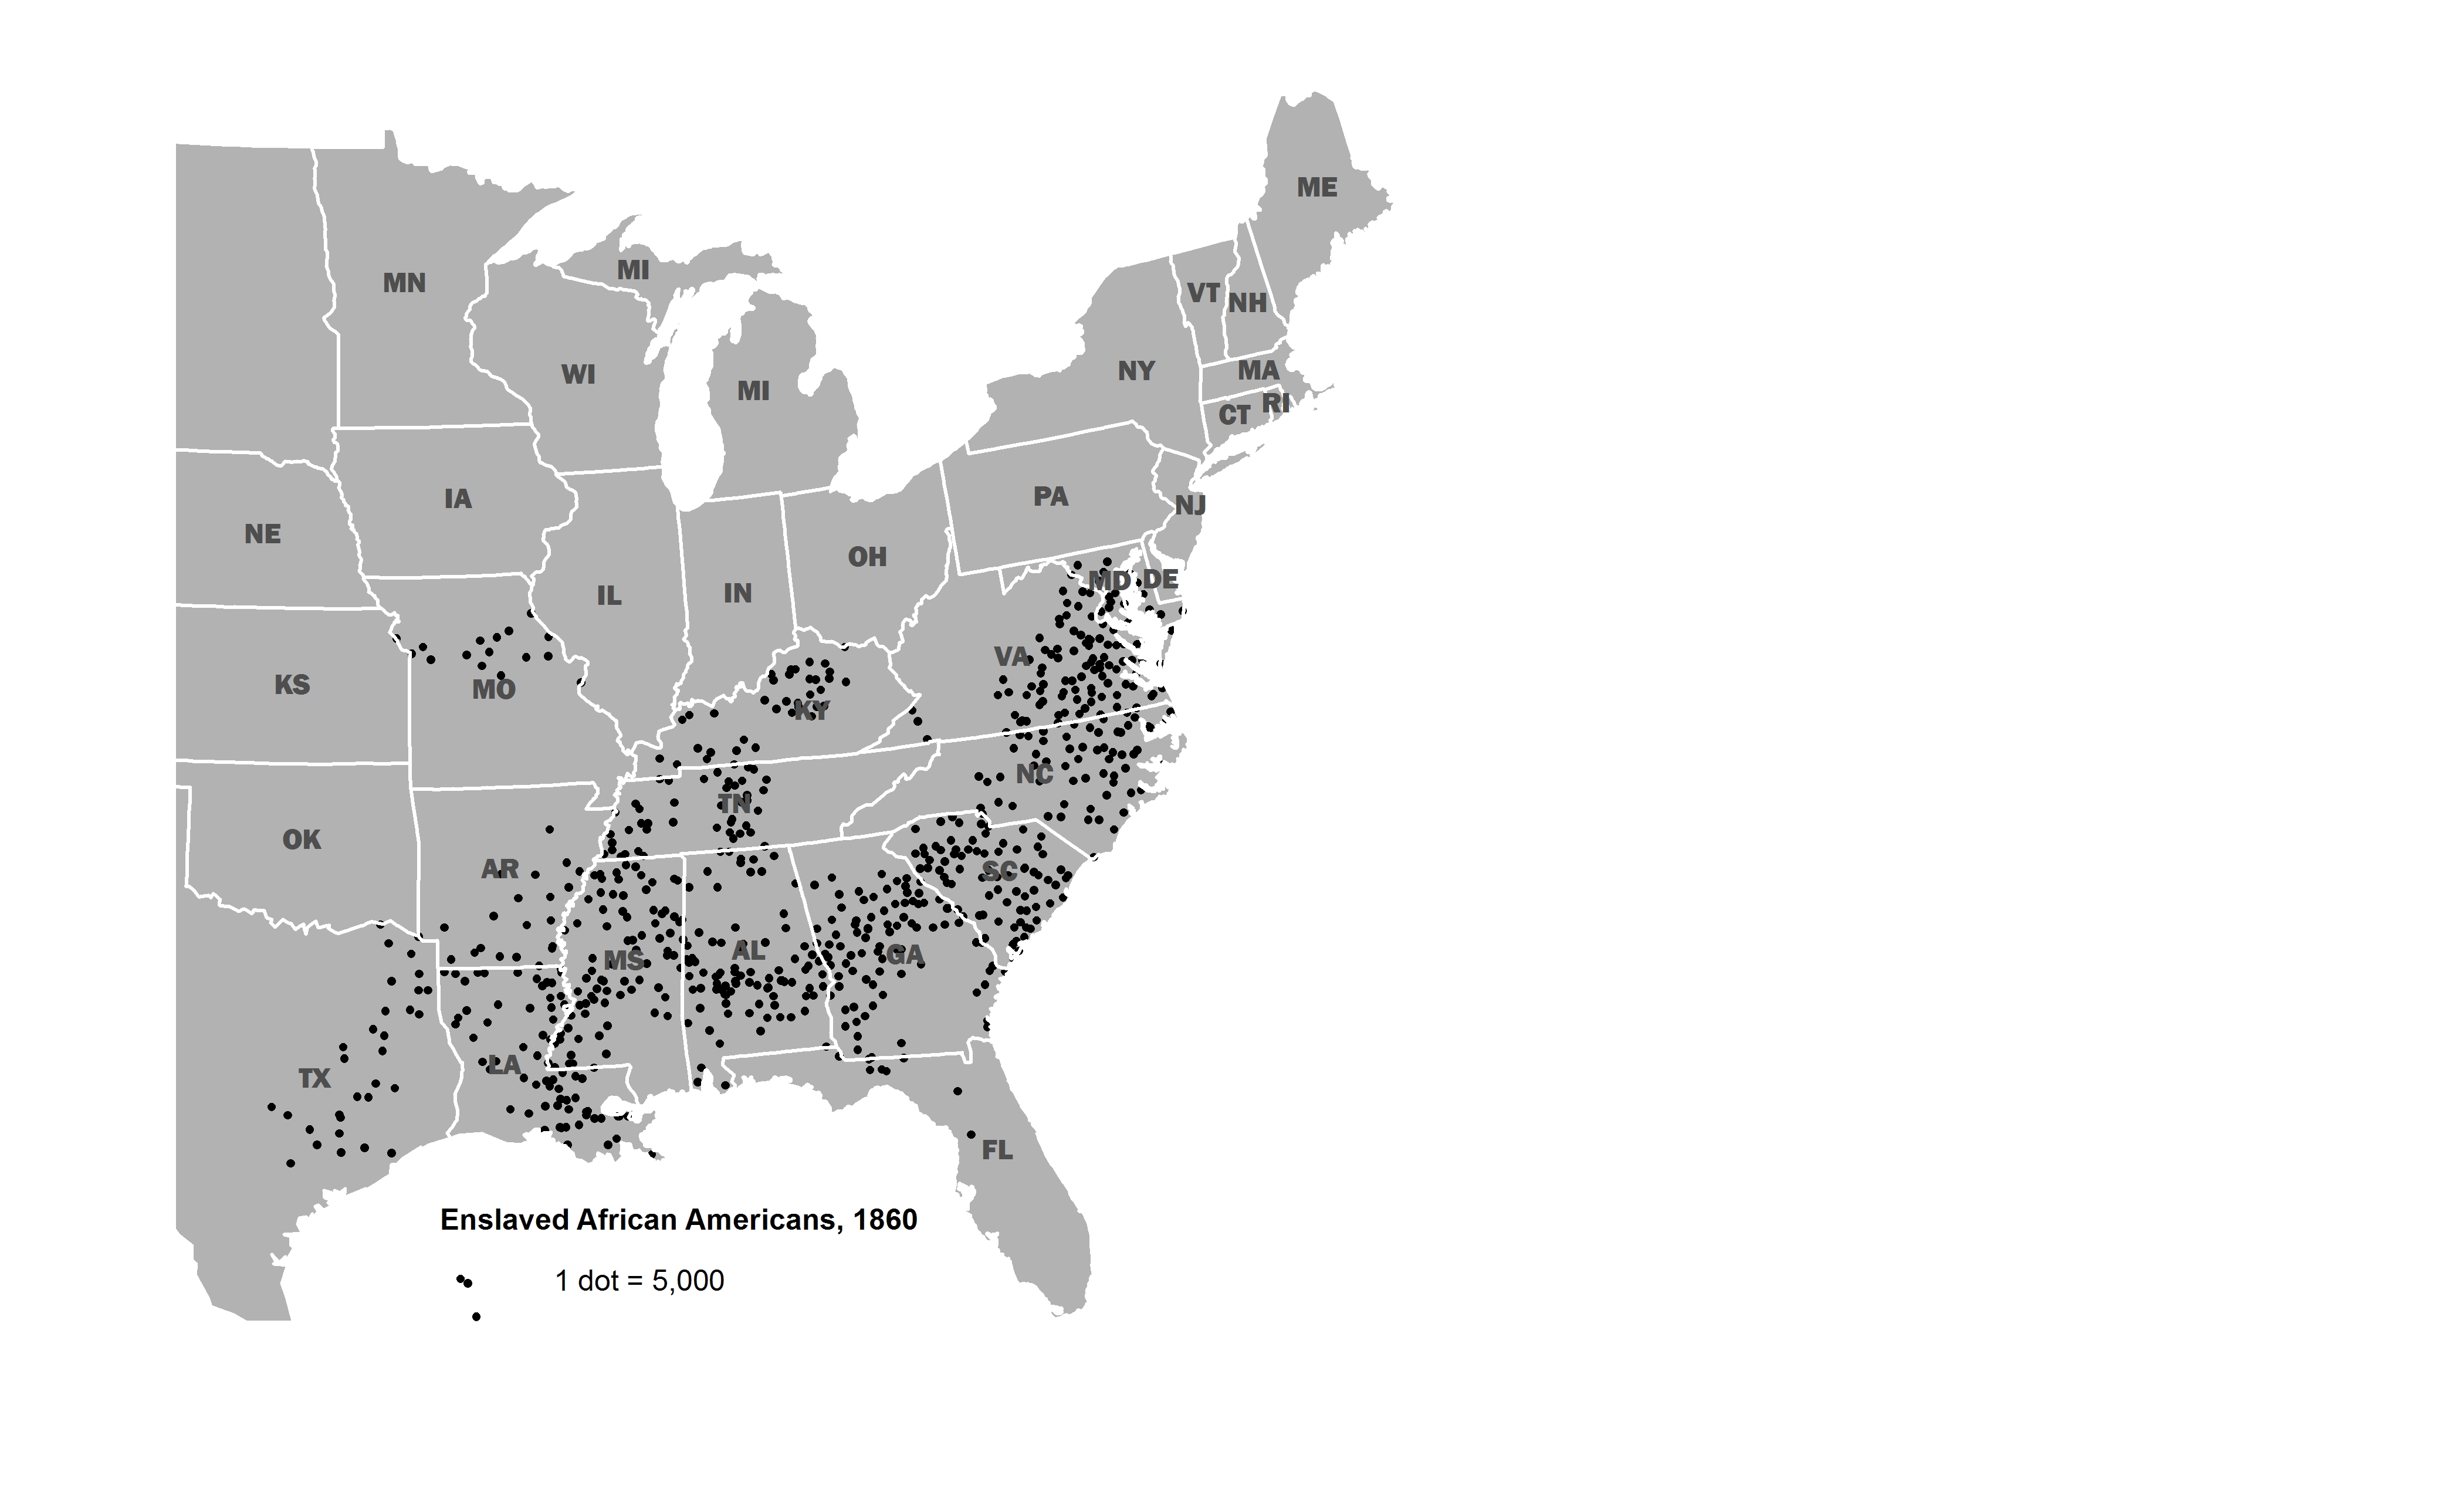
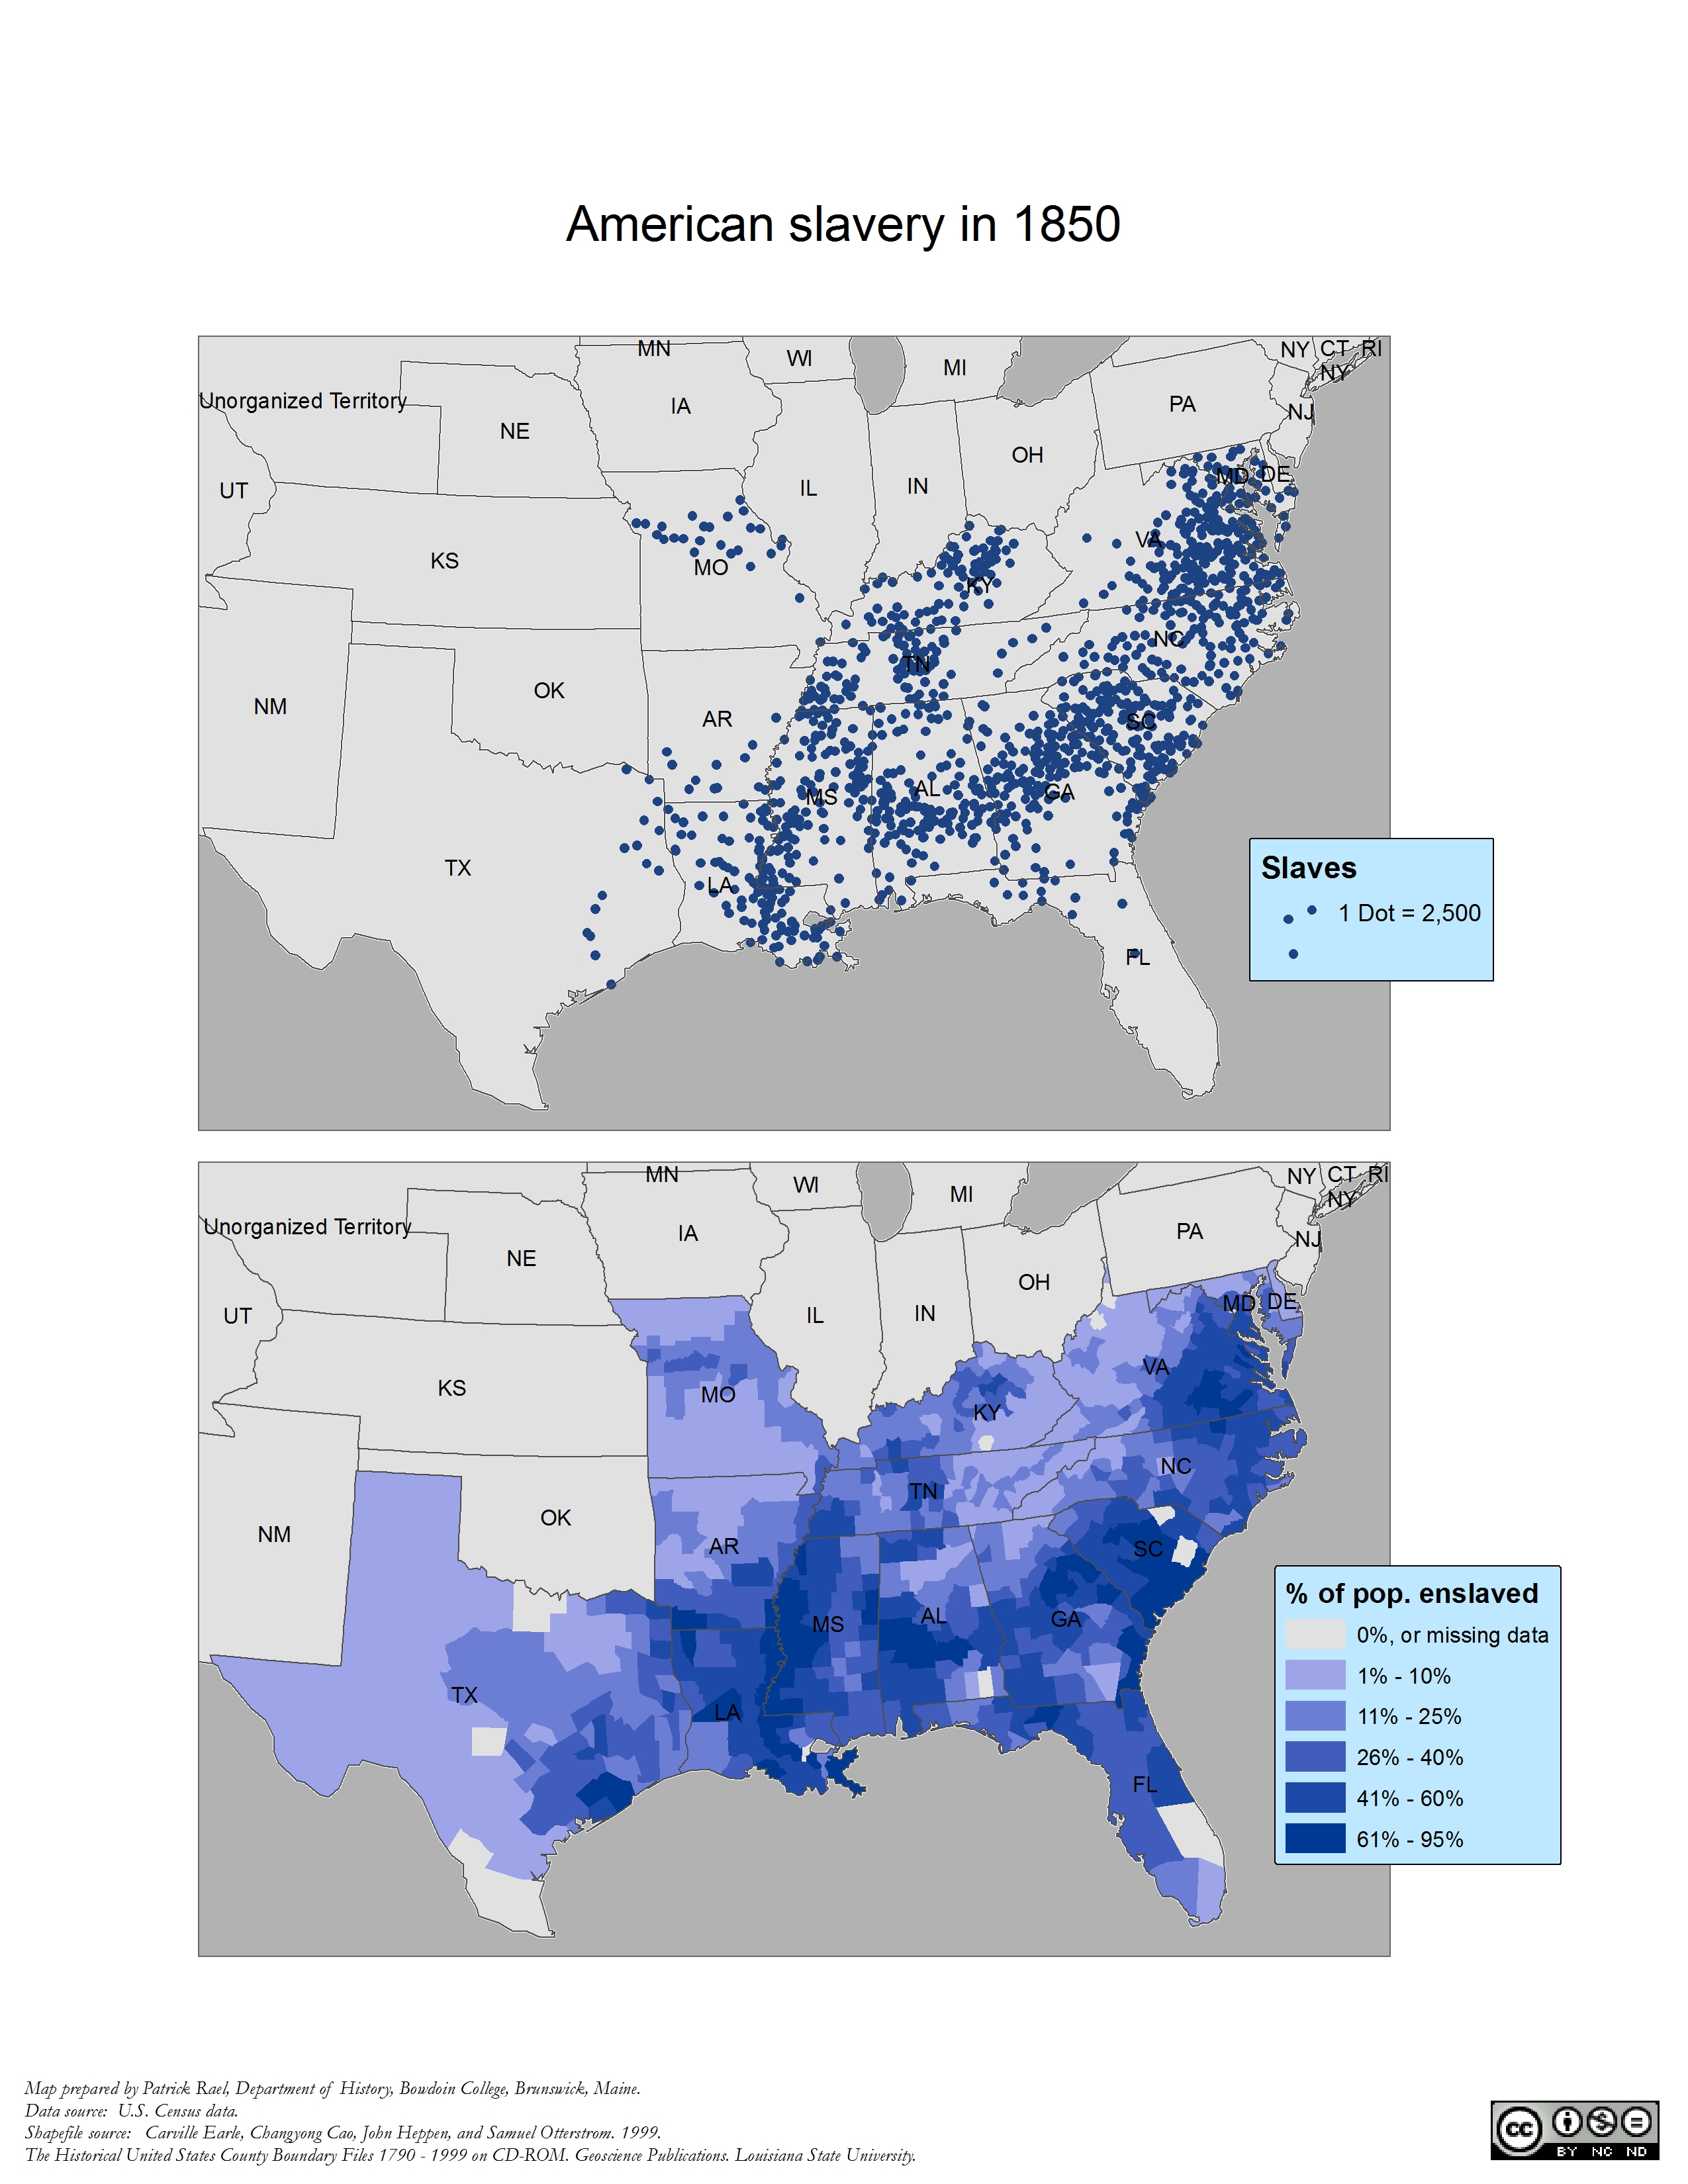
Let's first establish areas of high slave concentration and high farm value. The map below illustrates the four main areas of high slave cultivation: the South Carolina and Georgia seacoast (rice and cotton), the "black belt" sweeping through the middle portions of the Deep South states (cotton), and the lower Mississippi Valley (cotton and sugar), and the Upper South (tobacco and gains). Of these, the lower Mississippi Valley appears as the most important agricultural engine of the country.
Large and small(er) slaveholdings, 1860 |
Slave-grown crops, 1860 |
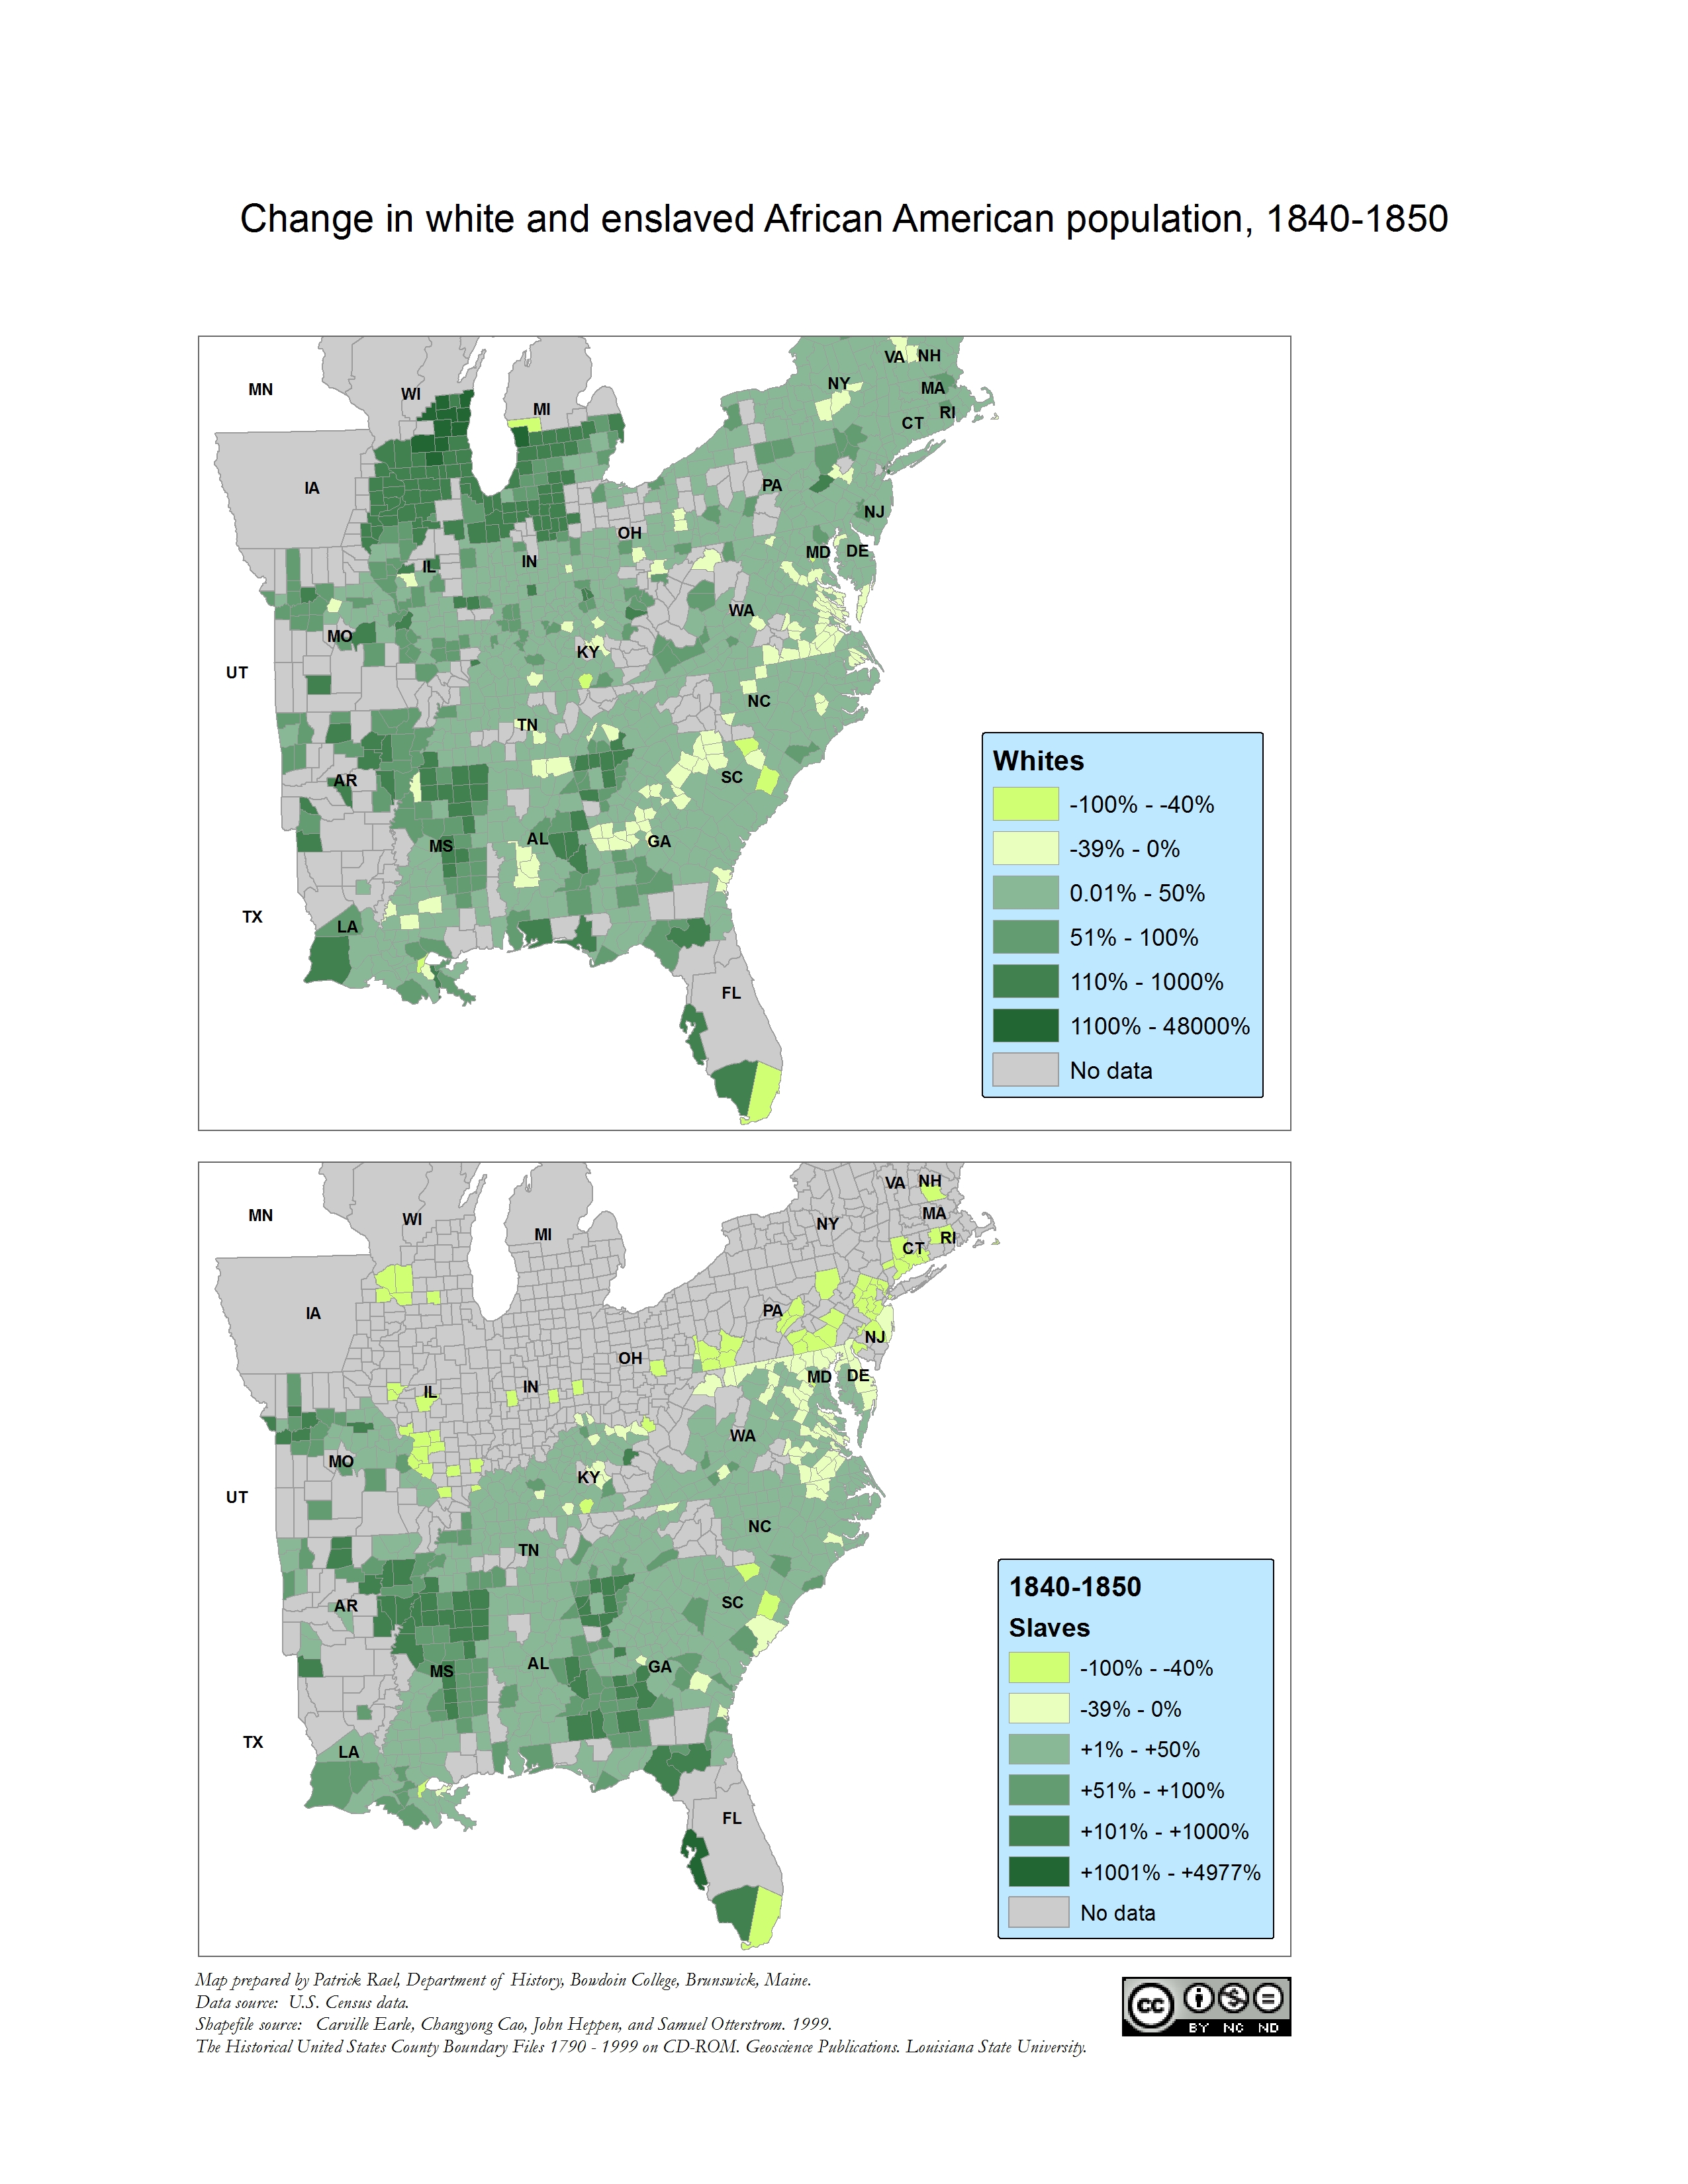
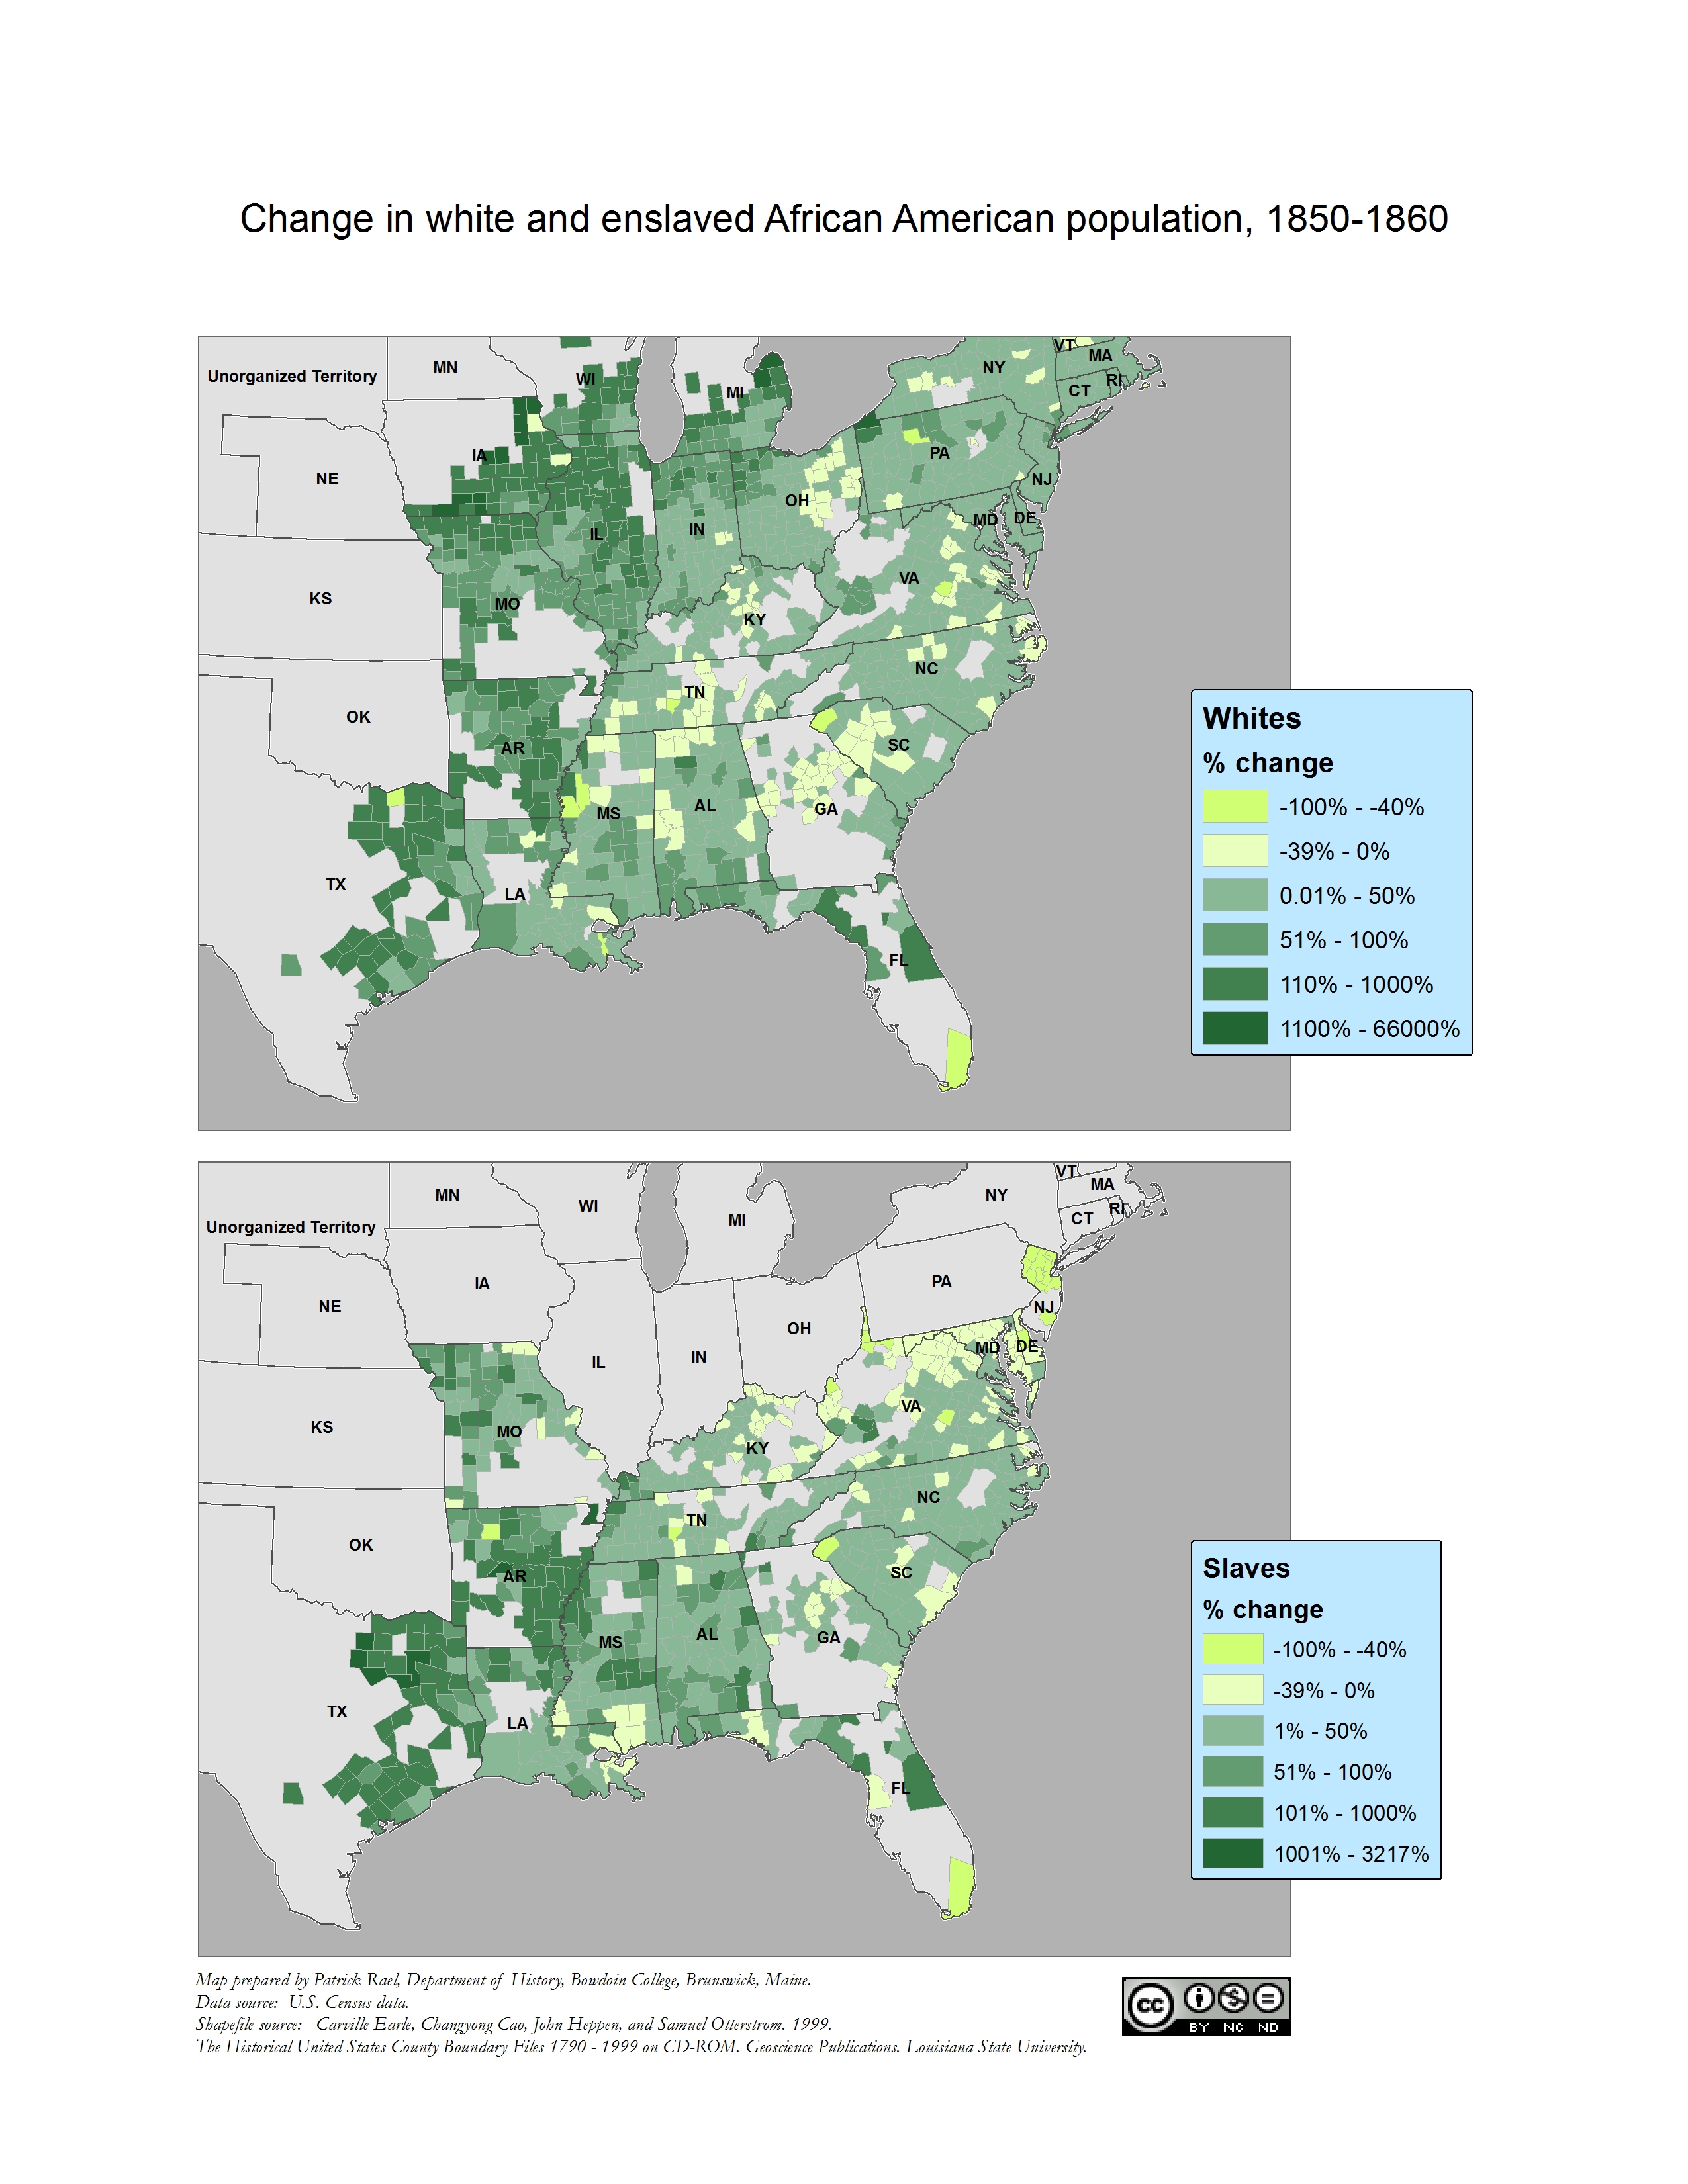
In the next two maps, which illustrate the change in population of counties from one decade to the next, we can clearly see the rapid expansion of all Americans into the West. Unsurprisingly, the enslaved population grew most quickly in the American Southwest. By 1840, Louisiana and the Lower Mississippi Valley had been established as the most dynamic part of the southern economy. New realms for slavery were opening in Texas and along the lower Missouri River.
Change in white and enslaved African American population, 1840 to 1850
|
Change in white and enslaved African American population, 1850 to 1860
|
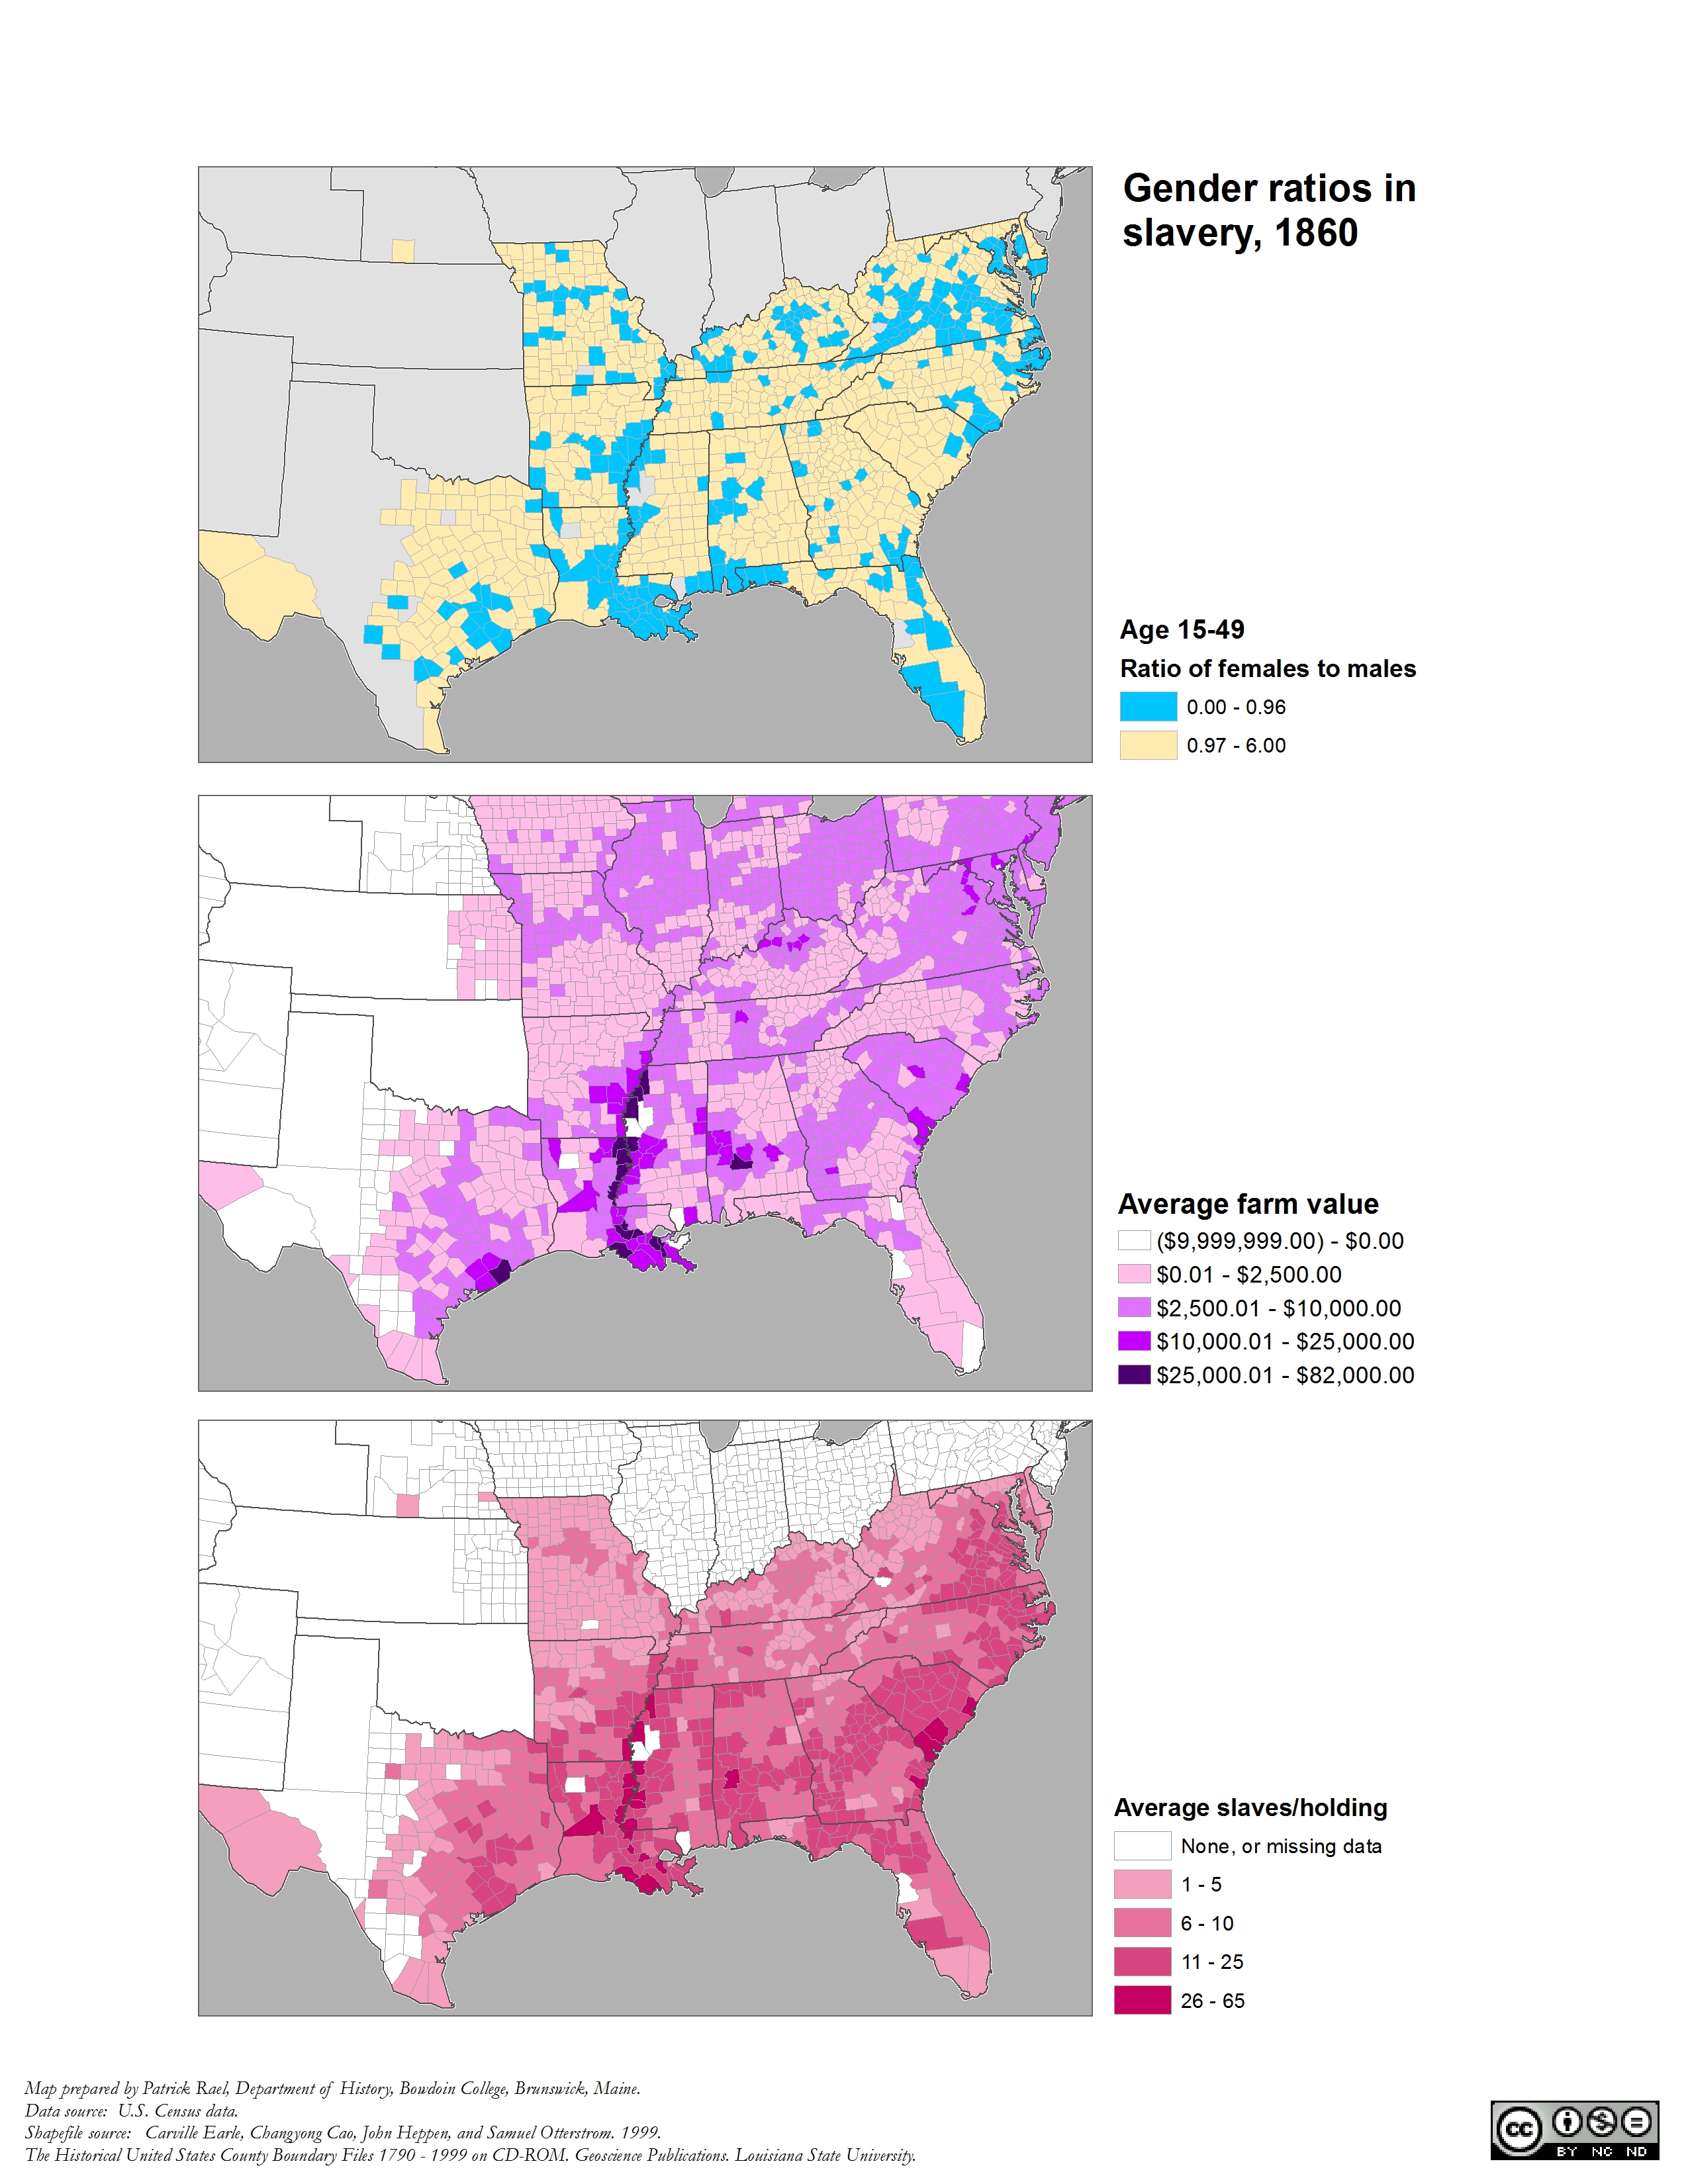
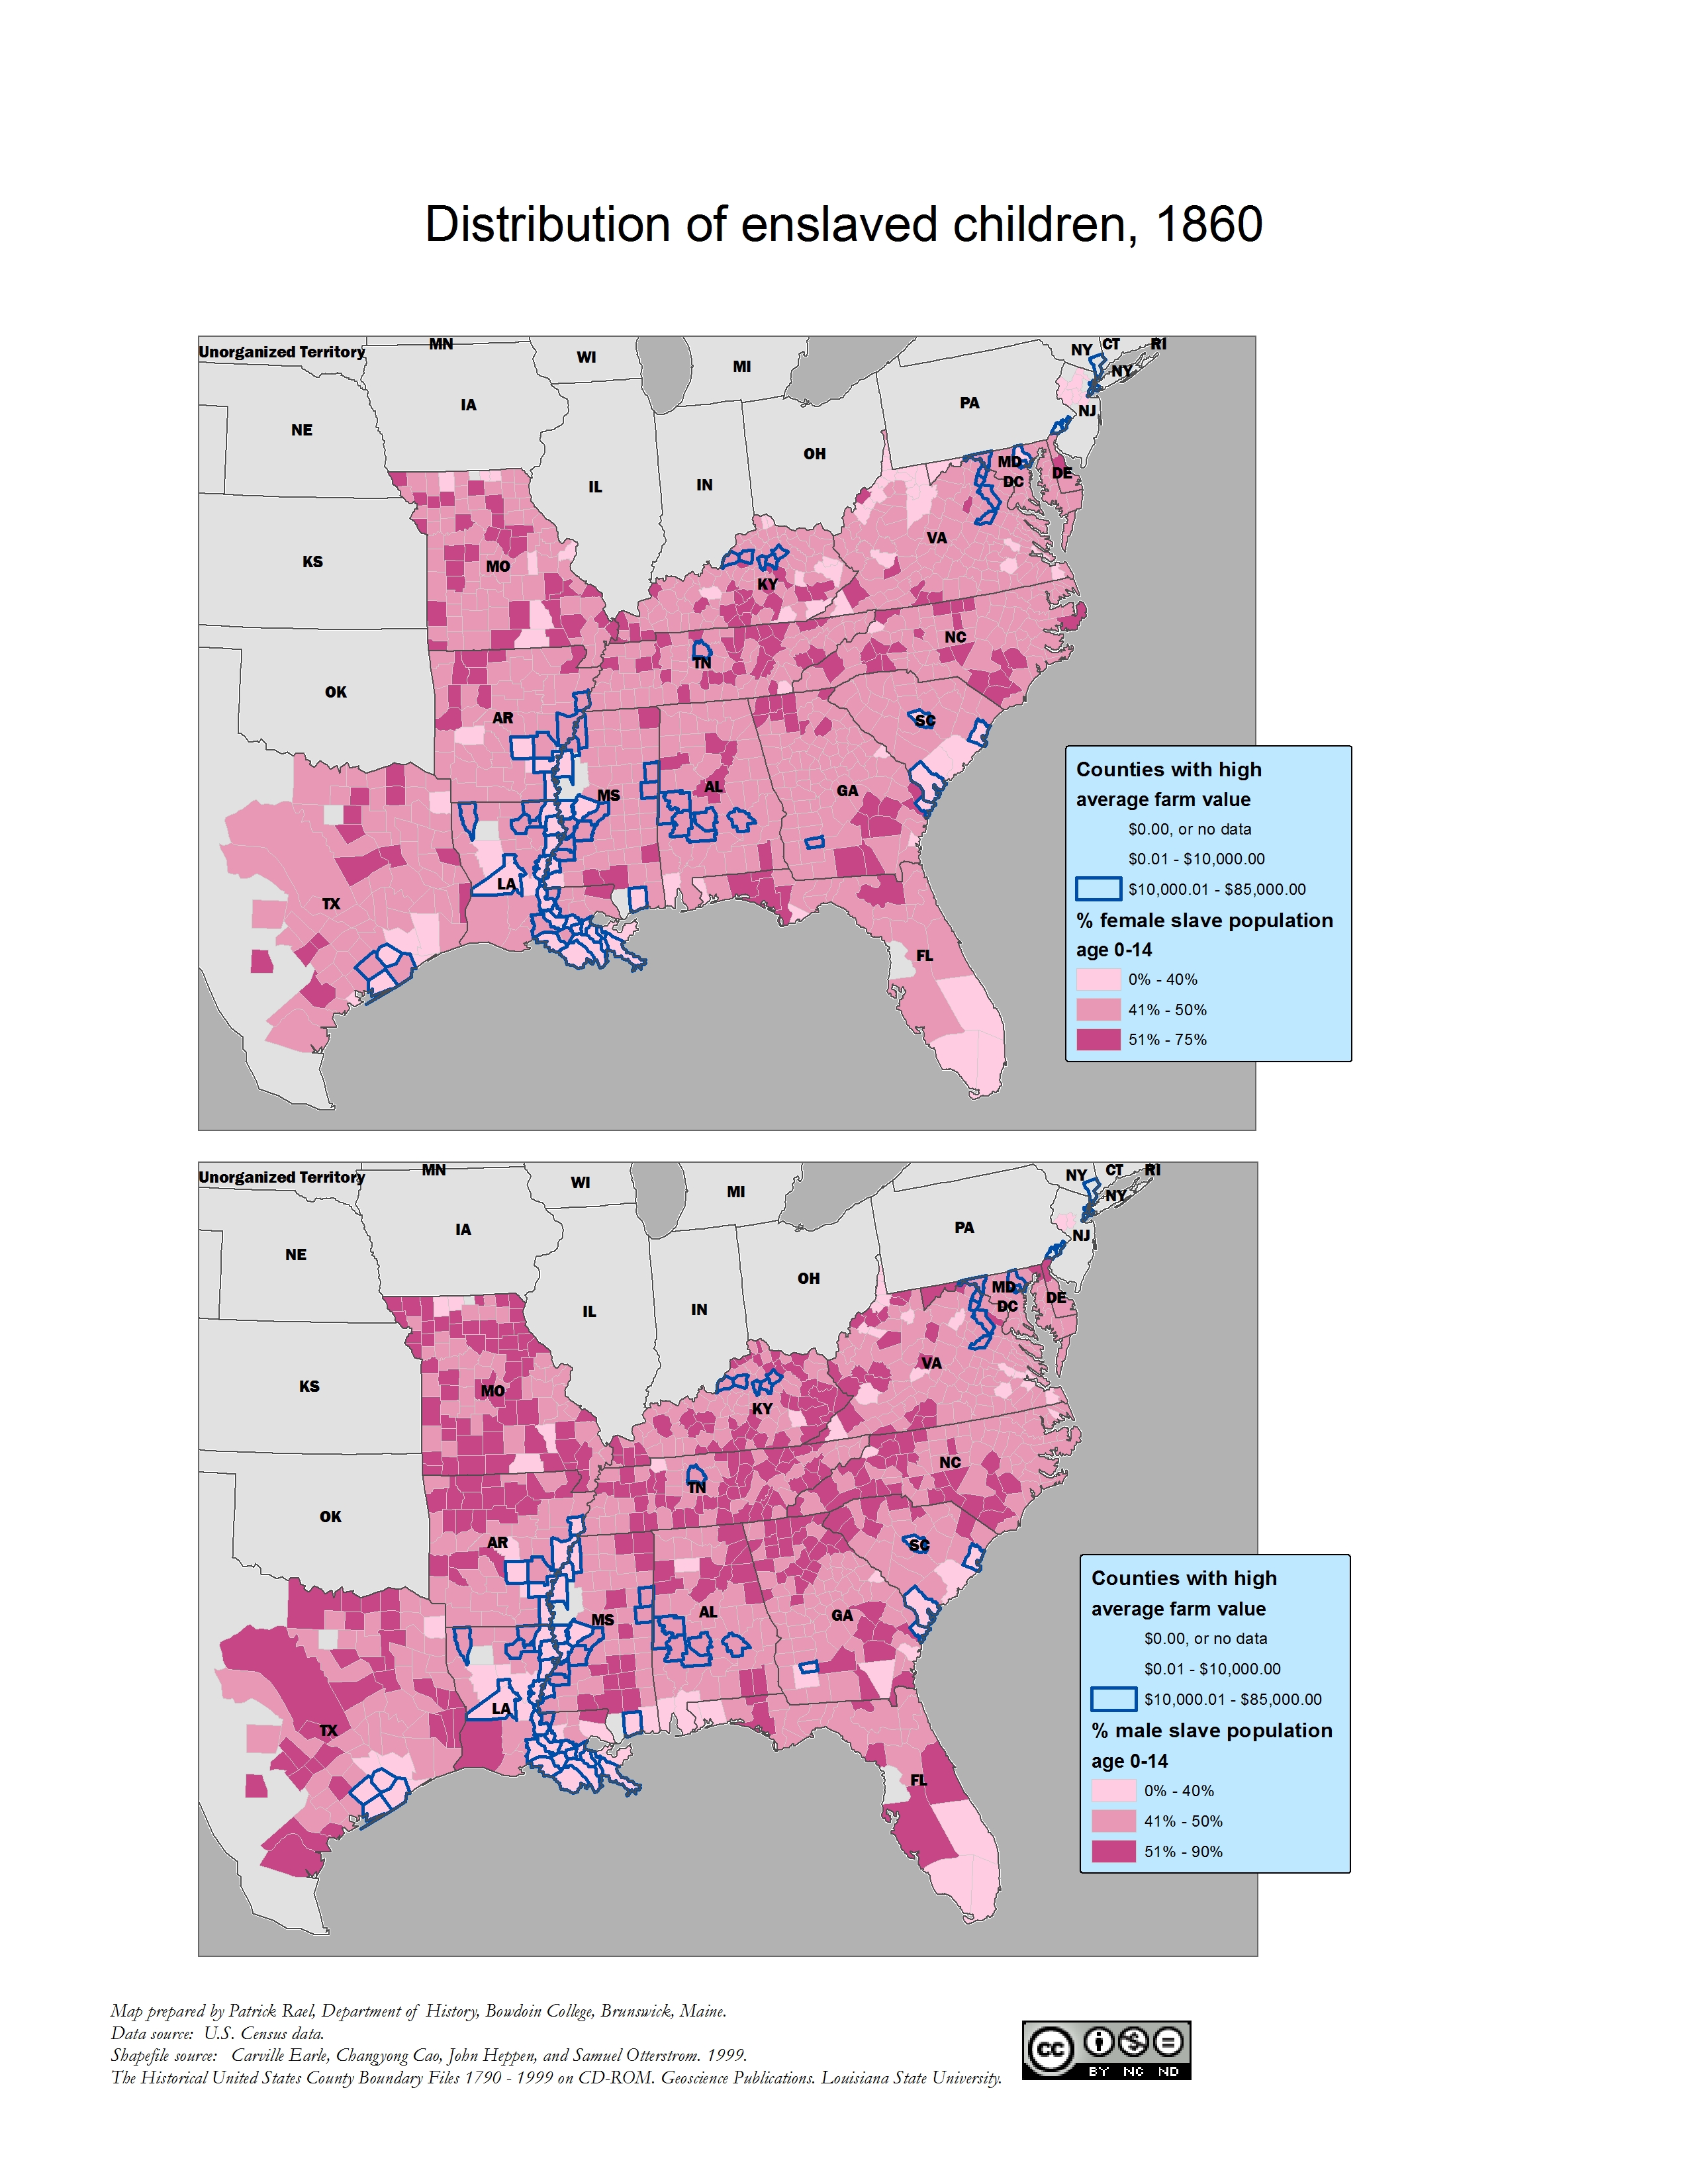
Finally, let's see if the data confirm our hypothesis about gender and children. The map on the left does suggest that there was frequently a high proponderance of adult male slaves in regions of high productivity and valuable farmland -- notably the lower Mississippi Valley, Alabama black belt, and Virginia. Additionally, there seems to have been in inverse relation between high farm value and the presence of enslaved children of both sexes. Counties with the most valuable farmland were notably deficient in children. It would make sense that these areas placed high demands on the internal slave for adult men, thus diminishing the proportion of children in them. Additionally, the harsh work regimes and skewed gender ratios of these areas were likely to have acted as inhibitors of childbirths.
Gender ratios in slavery, 1860
|
Distribution of enslaved children, 1860
|
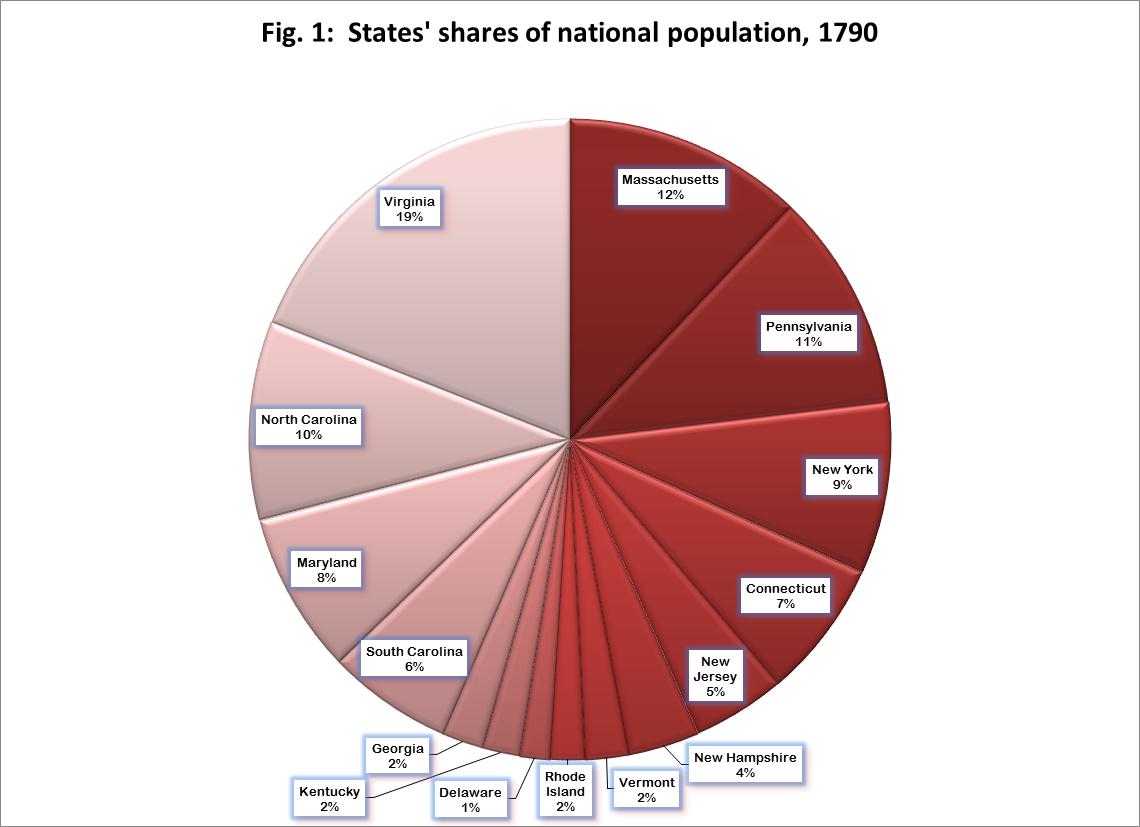
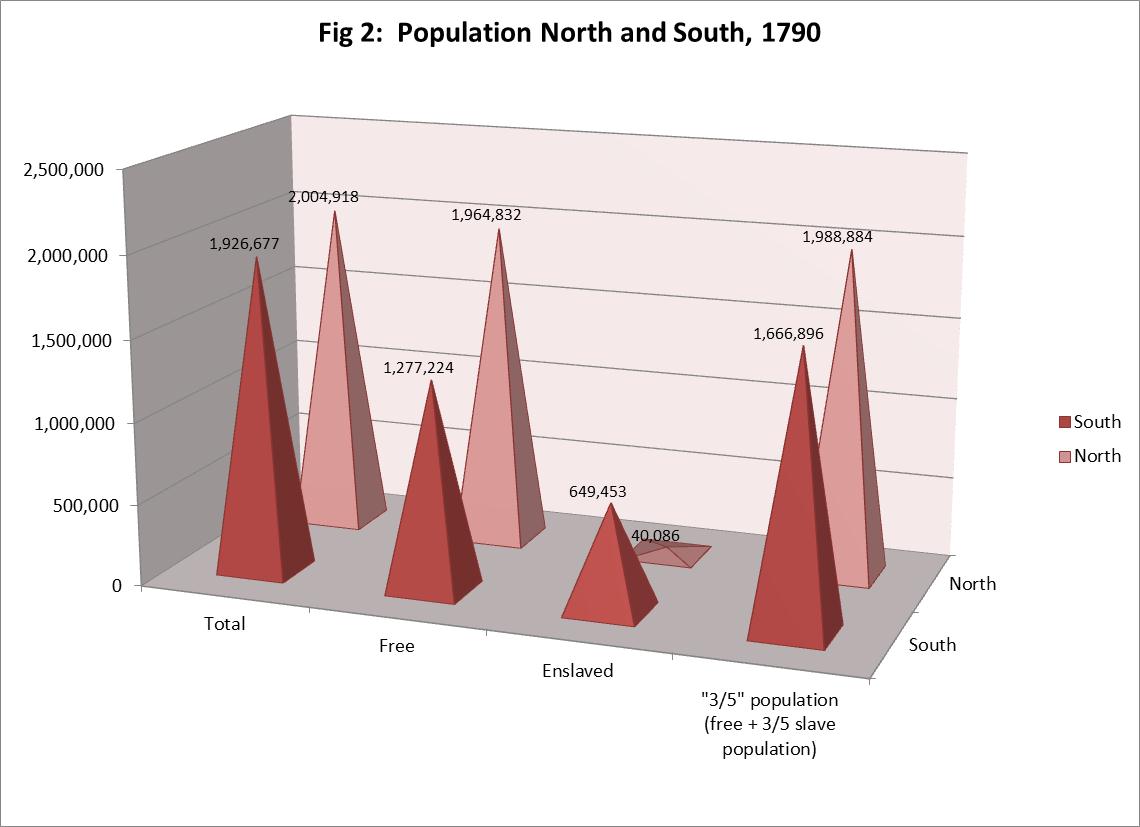
The Constitution (Art. 1, Sec. 2:3) specified that for purposes of apportioning representatives from the states, each state's free population would be considered, as well as three-fifths of "all other persons," or enslaved African Americans. Following the first federal census in 1790, the Constitution's plan went into effect when the Second Congress assigned representation in Congress and the Electoral College in the Apportionment Act of 1791.
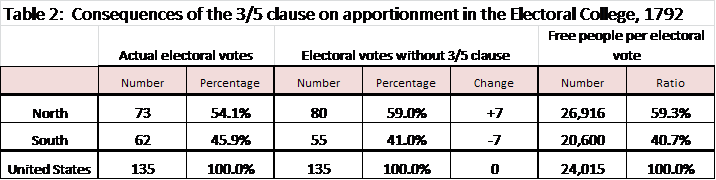
The consequences of the three-fifths clause were immediately apparent. Despite having no rights or representation in government, 390,000 of the South's 650,000 slaves were added to the population of its states. This meant that the northern states contained 61% of the nation's free population, yet controlled only 54% of seats in the House of Representatives and votes in the Electoral College.
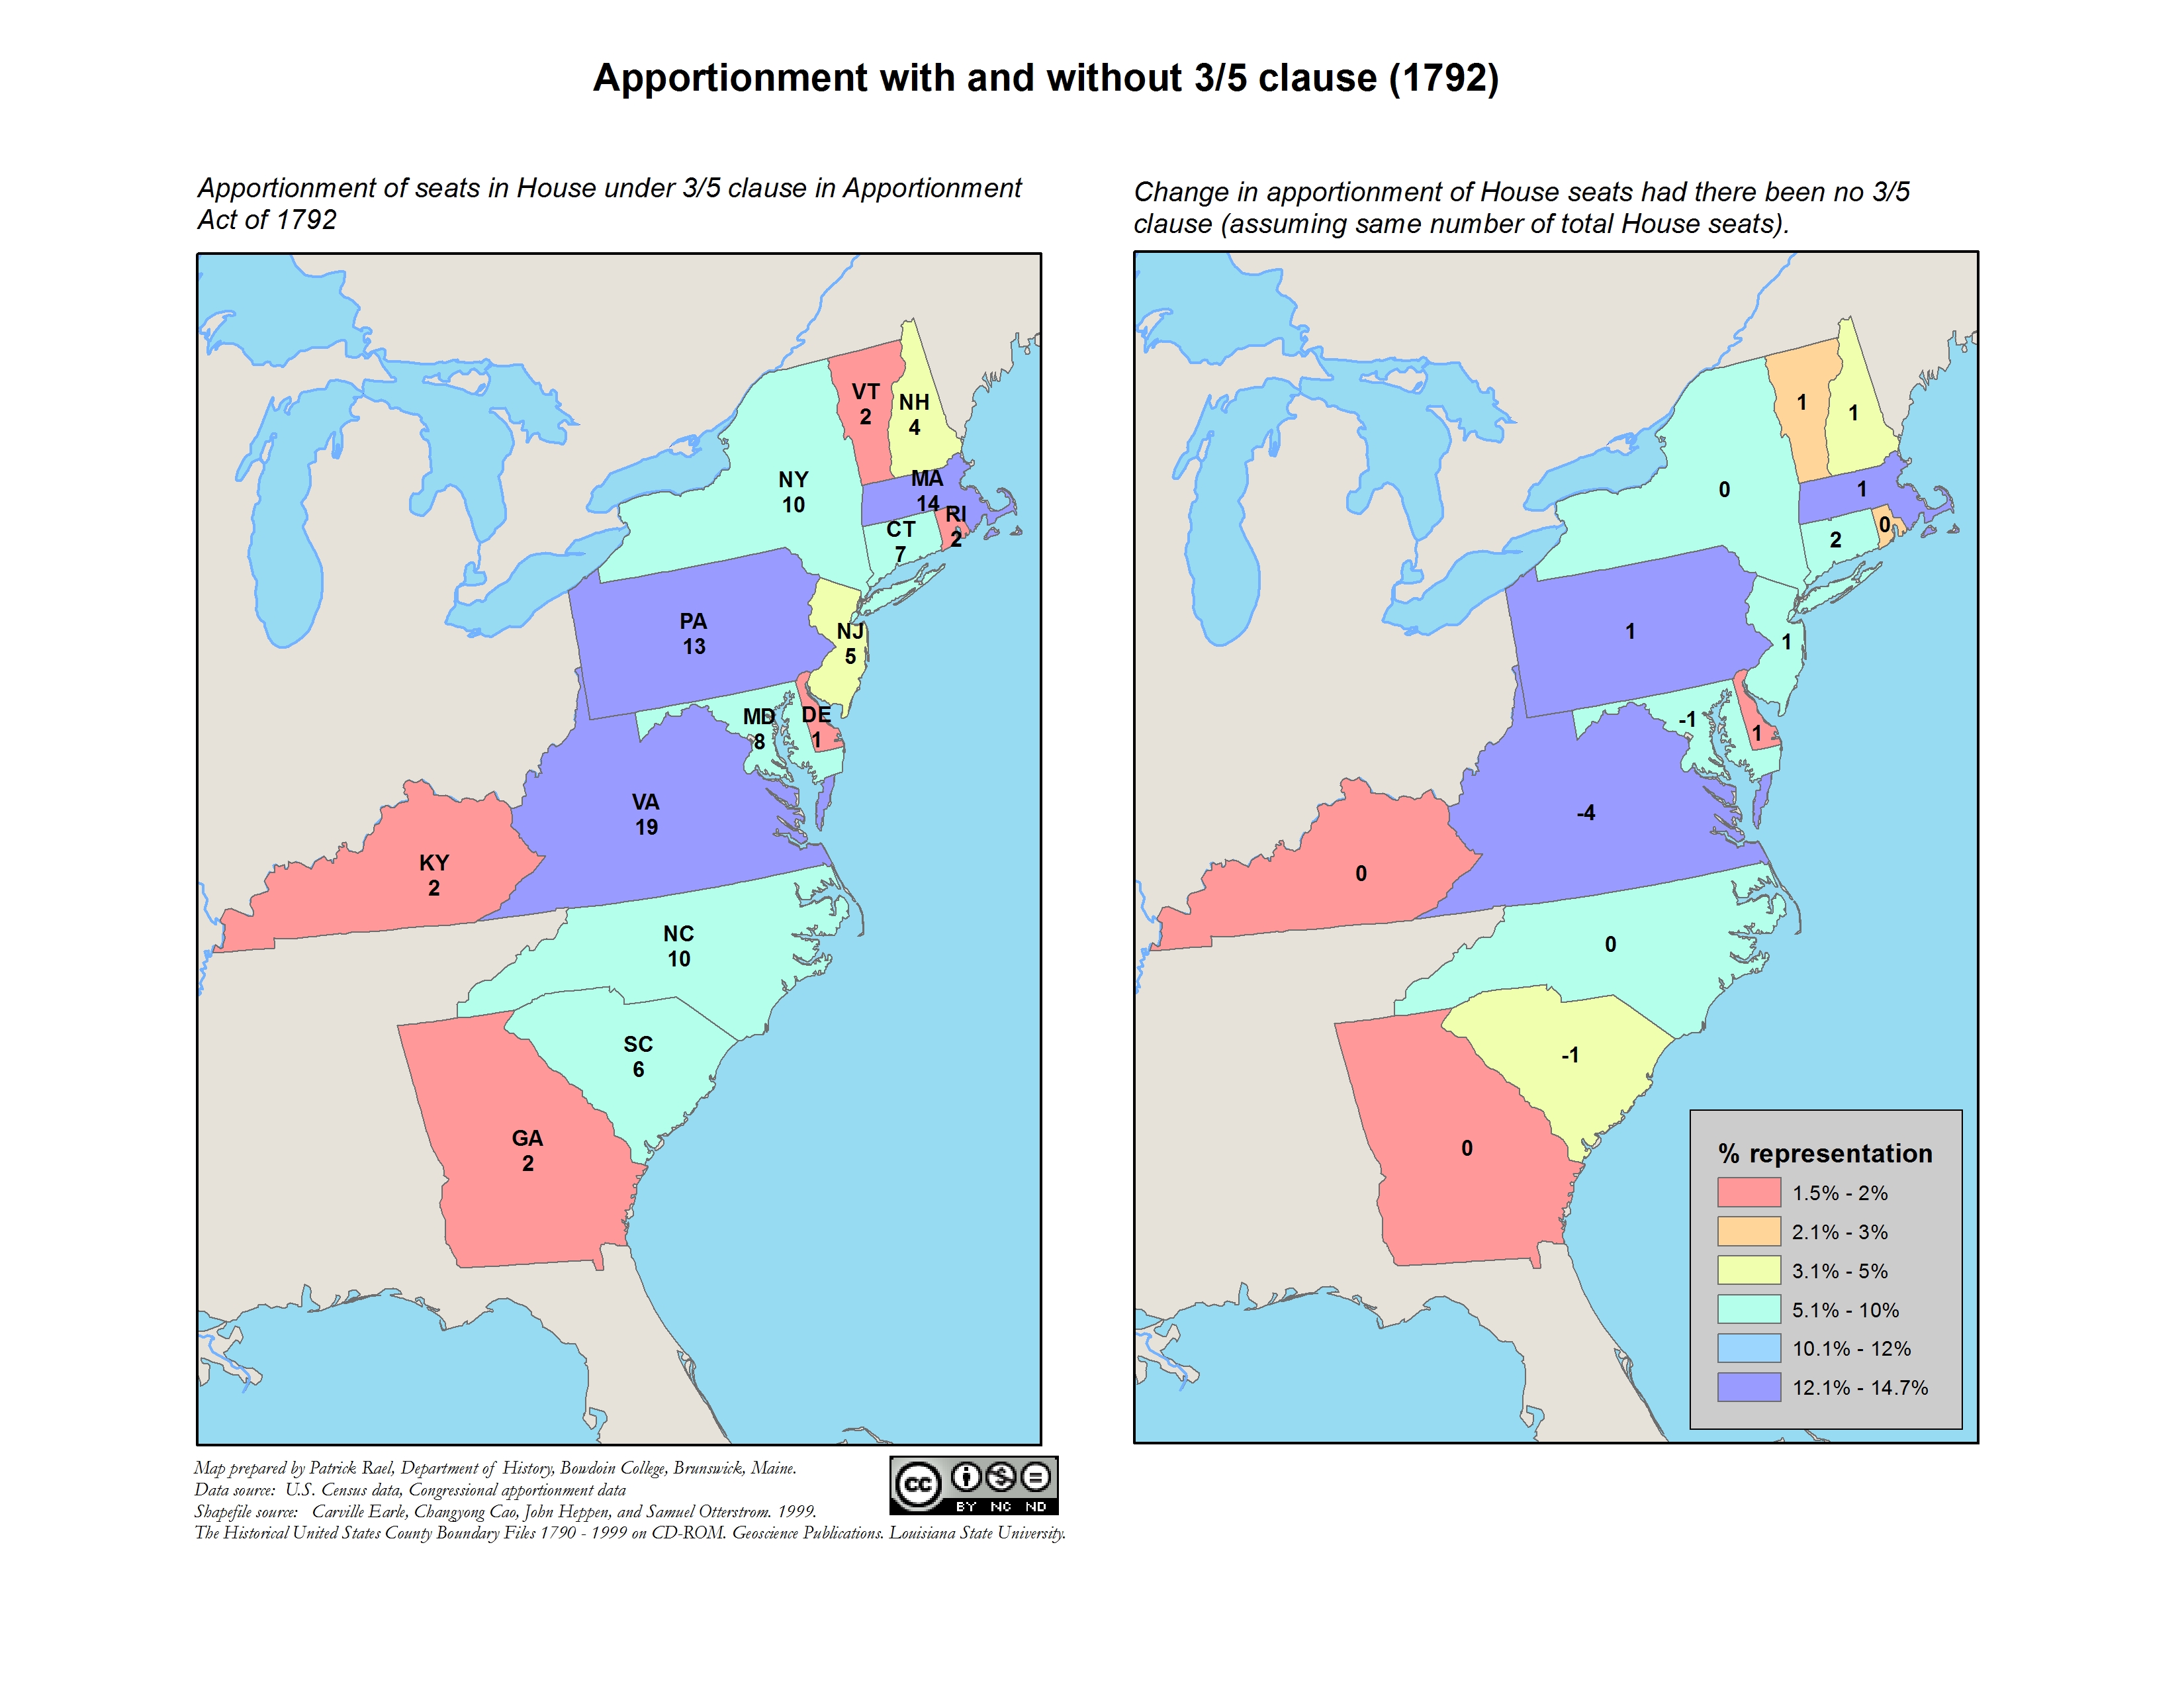
In the House, the 3/5 clause cost northern states 14 seats, or 12.6% of the total House representation.
In the Electoral College, the South also gained a 14-vote advantage, for a total gain of 9.8%. Effectively, this meant that every two free persons in the South commanded as large a share of the electoral vote as every three people in the North — a considerable difference in the concentration of power in the two regions.
Consistently from the founding of the nation through the 1840s, the 3/5 clause conferred upon the South an artificial advantage of about 10-12% in the House and Electoral College.
These circumstances were not lost on Northern politicians jealous of Southern power. Some considered the three-fifth clause "an original and radical defect in the form of government," while others feared that their forbears had unwittingly "made a covenant with death" in agreeing to the measure. Those such as Sereno Edwards Dwight denounced the "slave representation" permitted by the clause as a "rotten part of the Constitution," which "must be amputated."1 For the next seven decades, the issue would fester, until it finally resulted in secession and the Civil War.