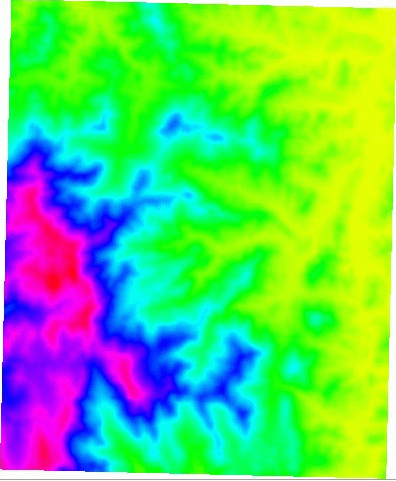
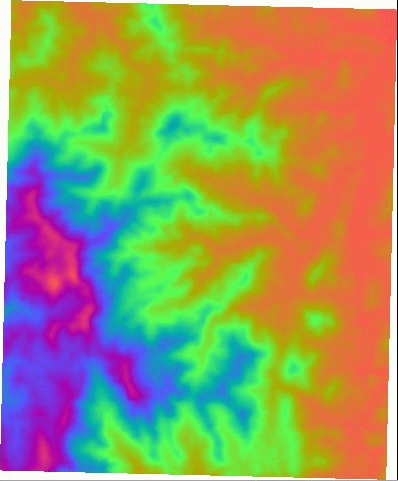
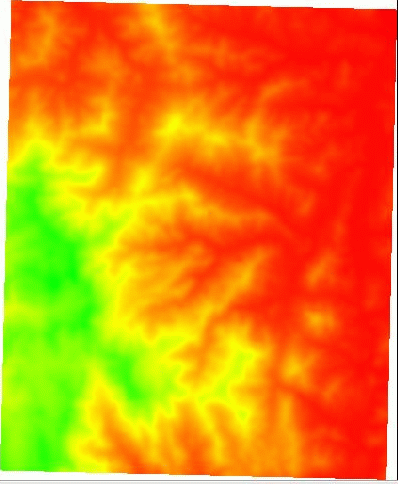
In this assignment you will write code to visualize a grid. Your program will read the input grid from file and render it in a 2D top-down view (that is, using the default openGL viewpoint and projection). The color of each point should be a function of the elevation of the point. To do this, you will need to write a colormap function to map an elevation range into a color range. Essentially you need to divide the grid elevation range into a number of buckets and assigns a color to each bucket. The number of buckets (i.e. different colors) will be a fixed constant of your choice (for e.g. between 5 and 10). You need to implement at least two color maps (black-gray-white, rainbow, etc). Below are some examples.


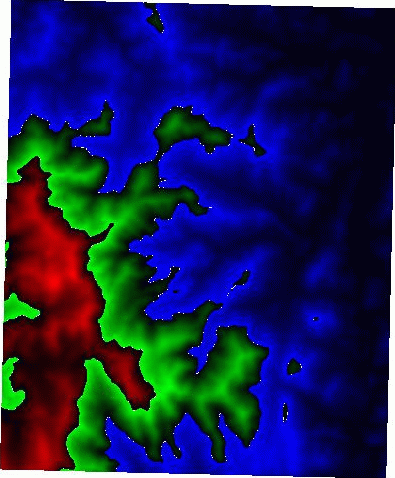
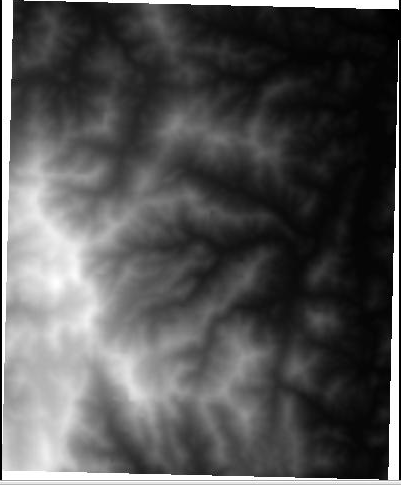
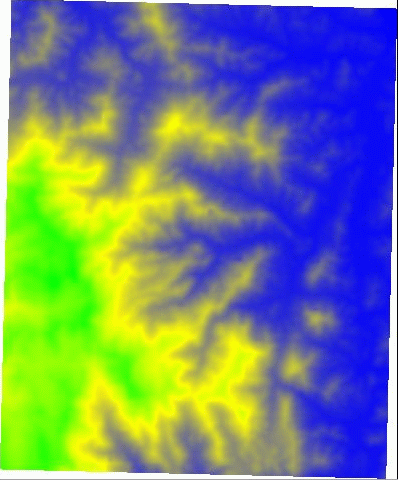
Your program should take one argument, the name of the grid. When invoked with a wrong number of arguments your program should display a help message just like a standard unix command. Your program should correctly handle the situations when the input file does not exist and other common error scenarios.
Your program should include a menu that:
You do not need to submit your code. We will demo it in class.